Market Outlook
March 08, 2018
Market Cues
Domestic Indices
Chg (%)
(Pts)
(Close)
Indian markets are likely to open positive tracking global indices and SGX Nifty.
BSE Sensex
(0.9)
(284)
33,033
U.S. stocks fluctuated over the course of the trading session. While the major
Nifty
(0.9)
(95)
10,154
averages all climbed well off their worst levels of the day, only the Nasdaq managed
Mid Cap
(1.3)
(213)
15,954
to close in positive territory. The Dow Jones fall by 0.3% to close at 24,801. The
Small Cap
(2.2)
(382)
17,270
NASDAQ gained 0.3% to close at 7,396.
Bankex
(1.4)
(381)
27,170
U.K. stocks were little changed after White House chief economic adviser Gary
Cohn, an advocate for free trade, resigned from the Trump administration, raising
Global Indices
Chg (%)
(Pts)
(Close)
concerns that Trump will go ahead with his plan to impose tariffs and risk a trade
war. The FTSE 100 was up by 0.2% to end at 7,158.
Dow Jones
(0.3)
(83)
24,801
Nasdaq
0.3
25
7,397
On domestic front, Indian shares fell for a sixth straight session as authorities
FTSE
0.2
11
7,158
widened a probe into Punjab National Bank's $2 billion fraud. BSE Sensex closed
lower by 0.9% at 33,033.
Nikkei
0.8
168
21,421
Hang Seng
1.4
419
30,616
News Analysis
Shanghai Com
0.1
2
3,274
Jaguar Land Rover global sales fall 2.6% in Feb amid weaker sales in Europe
Detailed analysis on Pg2
Advances / Declines
BSE
NSE
Advances
470
264
Investor’s Ready Reckoner
Declines
2,299
1,562
Key Domestic & Global Indicators
Unchanged
117
40
Stock Watch: Latest investment recommendations on 150+ stocks
Refer Pg5 onwards
Volumes (` Cr)
Top Picks
BSE
3,449
CMP
Target
Upside
Company
Sector
Rating
(`)
(`)
(%)
NSE
30,909
Blue Star
Capital Goods Accumulate
787
867
10.2
Dewan Housing Finance
Financials
Buy
498
720
44.7
Net Inflows (` Cr)
Net
Mtd
Ytd
Century Plyboards
Forest Products
Buy
322
400
24.1
FII
749
829
1,321
Navkar Corporation
Other
Buy
160
265
65.2
*MFs
1,673
13,261
22,284
KEI Industries
Capital Goods
Buy
361
436
20.7
More Top Picks on Pg4
Top Gainers
Price (`)
Chg (%)
Key Upcoming Events
Vakrangee
178
4.4
Previous
Consensus
Date
Region
Event Description
Reading
Expectations
Centralbk
66
3.9
Mar08
US
Initial Jobless claims
210.00
220.00
Hexaware
354
2.5
Mar08
China
Exports YoY%
11.10
11.00
Ipcalab
673
2.4
Mar08
UK
Industrial Production (YoY)
-
1.90
Network18
49
2.3
Mar09
Euro Zone ECB announces interest rates
-
-
Mar09
China
Consumer Price Index (YoY)
1.50
2.50
More Events on Pg7
Top Losers
Price (`)
Chg (%)
Fortis
147
(8.6)
Wabag
478
(8.4)
Jpassociat
15
(8.4)
Ktkbank
118
(8.2)
Andhrabank
39
(7.7)
As on March 07 2018
Market Outlook
March 08, 2018
News Analysis
Jaguar Land Rover global sales fall 2.6% in Feb amid weaker sales in
Europe
Tata Motors-owned Jaguar Land Rover (JLR) reported 2.6 per cent decline in
global sales at 39,911 units in February. Sales of Jaguar brand of vehicles in
February were at 11,565 units, a fall of 5.2 per cent. Land Rover range posted
sales of 28,346 units in the month, down 1.5 per cent.
Solid demand in China (up 3.3 per cent) and other overseas markets (up 1.5 per
cent) was offset by lower sales in the UK (down 15.2 per cent for the month) and
Europe (down 6.9 per cent), where trading conditions remained challenging.
Economic and Political News
Cabinet raises DA for central govt employees and pensioners to 7% from 5%
According to reports Railways incurs Rs 40-bn loss in 3 years by running
Mumbai locals
India's sugar output set to rise 45% to 29.5mt in 2017-18 season
Corporate News
Reliance Capital appoints Anand Natarajan as Chief Operating Officer
CCI penalises Jet, IndiGo, SpiceJet Rs 540 mn for unfair business ways
NTPC partners IIM-A to set up research centre for policy prescription
Infosys unveils technology and innovation hub in Indianapolis for employees
Market Outlook
March 08, 2018
Top Picks
Market Cap
CMP
Target
Upside
Company
Rationale
(` Cr)
(`)
(`)
(%)
Strong growth in domestic business due to its leade`hip
in acute therapeutic segment. Alkem expects to launch
Alkem Laboratories
26,482
2,215
2,441
10.2
more products in USA, which bodes for its international
business.
Favorable outlook for the AC industry to augur well for
Cooling products business which is out pacing the
Blue Star
7,549
787
867
10.2
market growth. EMPPAC division's profitability to
improve once operating environment turns around.
With a focus on the low and medium income (LMI)
consumer segment, the company has increased its
Dewan Housing Finance
15,612
498
720
44.7
presence in tier-II & III cities where the growth
opportunity is immense.
Loan growth is likely to pick up after a sluggish FY17.
Lower credit cost will help in strong bottom-line growth.
Karur Vysya Bank
7,261
100
160
60.1
Increasing share of CASA will help in NIM
improvement.
High order book execution in EPC segment, rising B2C
KEI Industries
2,830
361
436
20.7
sales and higher exports to boost the revenues and
profitability
Expected to benefit from the lower capex requirement
Music Broadcast
2,143
376
475
26.4
and 15 year long radio broadcast licensing.
Massive capacity expansion along with rail advantage
Navkar Corporation
2,414
160
265
65.2
at ICD as well CFS augur well for the company
Strong brands and distribution network would boost
Siyaram Silk Mills
2,891
617
851
38.0
growth going ahead. Stock currently trades at an
inexpensive valuation.
Market leadership in Hindi news genre and no.
2
viewership ranking in English news genre, exit from the
TV Today Network
2,672
448
508
13.4
radio business, and anticipated growth in ad spends by
corporate to benefit the stock.
After GST, the company is expected to see higher
volumes along with improving product mix. The Gujarat
Maruti Suzuki
2,62,175
8,679
10,619
22.4
plant will also enable higher operating leverage which
will be margin accretive.
We expect loan book to grow at 24.3% over next two
GIC Housing
2,033
378
655
73.5
year; change in borrowing mix will help in NIM
improvement
We expect CPIL to report net Revenue/PAT CAGR of
~17%/16% over FY2017-20E mainly due to healthy
7,161
322
400
24.1
growth in plywood & lamination business, forayed into
Century Plyboards India
MDF & Particle boards on back of strong brand &
distribution network.
We expect sales/PAT to grow at 13.5%/20% over next
LT Foods
2,765
86
128
48.1
two years on the back of strong distribution network &
addition of new products in portfolio.
Third largest brand play in luggage segment Increased
product offerings and improving distribution network is
Safari Industries
1,179
530
650
22.6
leading to strong growth in business. Likely to post
robust growth for next 3-4 years
We expect HSIL to report PAT CAGR of ~15% over
FY2017-20E owing to better improvement in operating
HSIL
3,002
415
510
22.8
margin due price hike in container glass segment,
turnaround in consumer business.
We expect financialisation of savings and increasing
Aditya Birla Capital
35841
154
230
49.5
penetration in Insurance & Mutual fund would ensure
steady growth.
Source: Company, Angel Research
Market Outlook
March 08, 2018
Fundamental Call
Market Cap
CMP
Target
Upside
Company
Rationale
(` Cr)
(`)
(`)
(%)
CCL is likely to maintain the strong growth trajectory
CCL Products
3,923
295
360
22.1
over FY18-20 backed by capacity expansion and new
geographical foray
We forecast Nilkamal to report top-line CAGR of ~9%
to `2,635cr over FY17-20E on the back of healthy
Nilkamal
2,452
1,643
2,178
32.6
demand growth in plastic division. On the bottom-line
front, we estimate ~10% CAGR to `162cr owing to
improvement in volumes.
We expect sales/PAT to grow at 9%/14% over next two
years on the back of healthy demand growth in
Shreyans Industries
204
148
247
67.3
printing. Further, China had banned making paper
from waste pulp which would benefit Indian paper
companies.
The prism has diversified exposure in the different
segment such as Cement, Tile & ready mix concrete.
Prism Cement
5,834
116
160
38.1
Thus we believe, PCL is in the right place to capture
ongoing government spending on affordable housing
and infrastructure projects.
Elantas Beck India is the Indian market leader in liquid
insulation segment used in electrical equipments like
Elantas Beck India Ltd
1,598
2,016
2,500
24.0
motors, transformers etc. It derives demand from
several industries which are expected to register 10%+
CAGR in demand in the coming years.
RPL to report healthy top-line CAGR of ~13% over
FY17-20E on the back of healthy demand in printing &
Ruchira Papers Ltd.
365
163
244
49.9
writing paper segments. On the bottom-line front, we
estimate ~16% CAGR over FY17-20E owing to strong
improvement in operating performance.
Greenply Industries Ltd (GIL) manufactures plywood &
allied products and medium density fibreboards
(MDF). GIL to report net revenue CAGR of ~14% to
Greenply Industries
4,011
327
395
20.8
~`2,478cr over FY2017-20E mainly due to healthy
growth in plywood & lamination business on the back
of strong brand and distribution network
Source: Company, Angel Research
Market Outlook
March 08, 2018
Key Upcoming Events
Global economic events release calendar
Bloomberg Data
Date
Time Country
Event Description
Unit
Period
Last Reported
Estimated
Mar 08, 2018
7:00 PMUS
Initial Jobless claims
Thousands
Mar 3
210.00
220.00
China
Exports YoY%
% Change
Feb
11.10
11.00
3:00 PMUK
Industrial Production (YoY)
% Change
Jan
-
1.90
Mar 09, 2018
6:15 PMEuro Zone
ECB announces interest rates
%
Mar 8
-
-
7:00 AMChina
Consumer Price Index (YoY)
% Change
Feb
1.50
2.50
5:30 PMIndia
Industrial Production YoY
% Change
Jan
7.10
7:00 PMUS
Change in Nonfarm payrolls
Thousands
Feb
200.00
200.00
Mar 12, 2018
7:00 PMUS
Unnemployment rate
%
Feb
4.10
4.00
Mar 13, 2018
6:00 PMUS
Consumer price index (mom)
% Change
Feb
0.50
0.20
Mar 14, 2018
12:00 PMIndia
Monthly Wholesale Prices YoY%
% Change
Feb
2.84
US
Producer Price Index (mom)
% Change
Feb
0.70
Mar 15, 2018
India
Imports YoY%
% Change
Feb
26.10
India
Exports YoY%
% Change
Feb
9.10
Mar 16, 2018
3:30 PMEuro Zone
Euro-Zone CPI (YoY)
%
Feb F
1.20
6:45 PMUS
Industrial Production
%
Feb
(0.05)
0.25
6:00 PMUS
Housing Starts
Thousands
Feb
1,326.00
1,280.00
6:00 PMUS
Building permits
Thousands
Feb
1,377.00
1,320.00
Mar 20, 2018
3:00 PMUK
CPI (YoY)
% Change
Feb
3.00
8:30 PMEuro Zone
Euro-Zone Consumer Confidence
Value
Mar A
0.10
Mar 21, 2018
7:30 PMUS
Existing home sales
Million
Feb
5.38
3:00 PMUK
Jobless claims change
% Change
Feb
(7.20)
11:30 PMUS
FOMC rate decision
%
Mar 21
1.50
1.75
Mar 22, 2018
2:00 PMGermany
PMI Services
Value
Mar P
55.30
2:00 PMGermany
PMI Manufacturing
Value
Mar P
60.60
Source: Bloomberg, Angel Research
Market Outlook
March 08, 2018
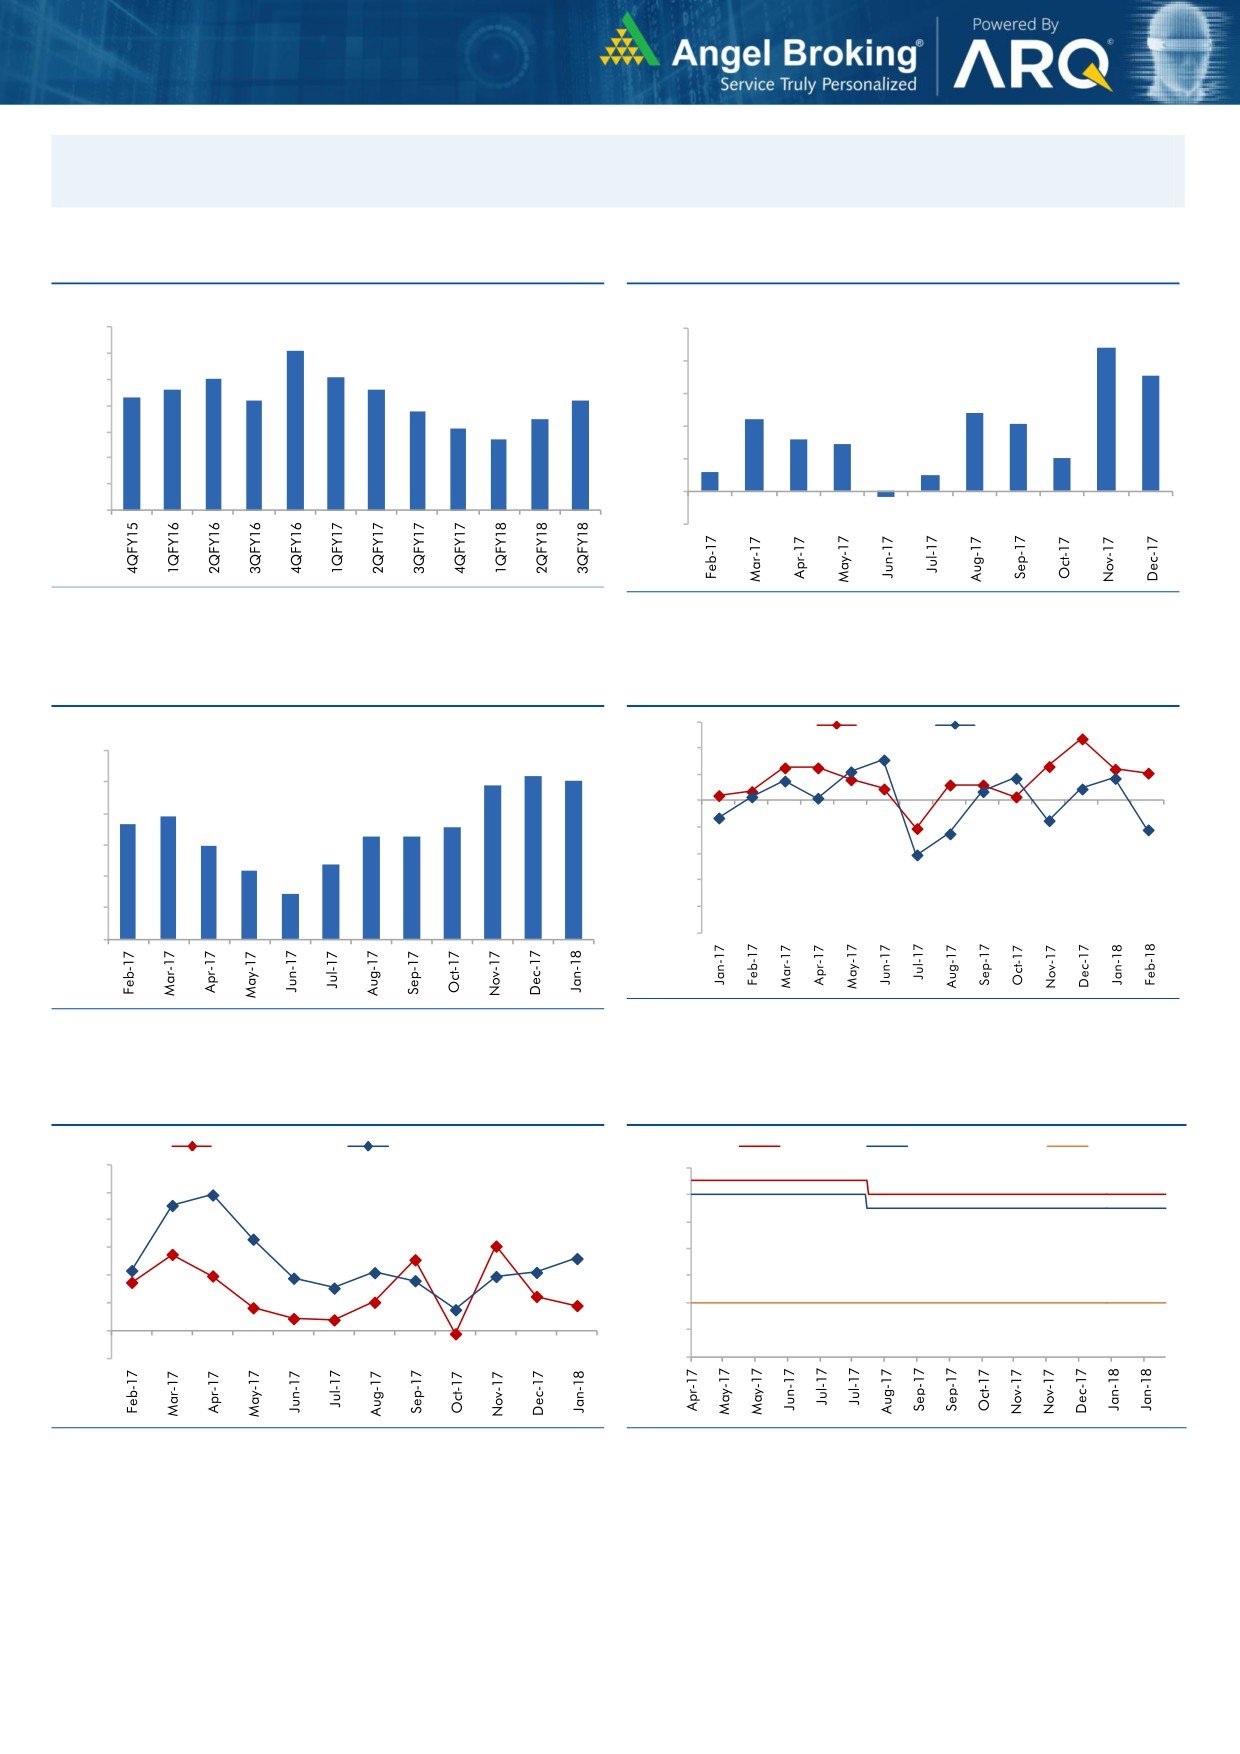
Macro watch
Exhibit 1: Quarterly GDP trends
Exhibit 2: IIP trends
(%)
(%)
10.0
10.0
9.1
8.8
9.0
8.0
8.1
8.0
7.1
7.6
7.6
8.0
7.3
7.2
7.2
6.8
6.0
4.8
7.0
6.5
4.4
6.1
4.1
5.7
4.0
3.2
2.9
6.0
2.0
5.0
2.0
1.2
1.0
4.0
-
3.0
(0.3)
(2.0)
Source: CSO, Angel Research
Source: MOSPI, Angel Research
Exhibit 3: Monthly CPI inflation trends
Exhibit 4: Manufacturing and services PMI
56.0
Mfg. PMI
Services PMI
(%)
6.0
54.0
5.2
5.1
4.9
52.0
5.0
3.9
50.0
3.7
3.6
4.0
3.3
3.3
3.0
48.0
3.0
2.4
2.2
46.0
2.0
1.5
44.0
1.0
42.0
40.0
-
Source: Market, Angel Research; Note: Level above 50 indicates expansion
Source: MOSPI, Angel Research
Exhibit 5: Exports and imports growth trends
Exhibit 6: Key policy rates
(%)
Exports yoy growth
Imports yoy growth
(%)
Repo rate
Reverse Repo rate
CRR
60.0
6.50
50.0
6.00
40.0
5.50
30.0
5.00
20.0
4.50
10.0
4.00
0.0
3.50
(10.0)
3.00
Source: Bloomberg, Angel Research
Source: RBI, Angel Research
Market Outlook
March 08, 2018
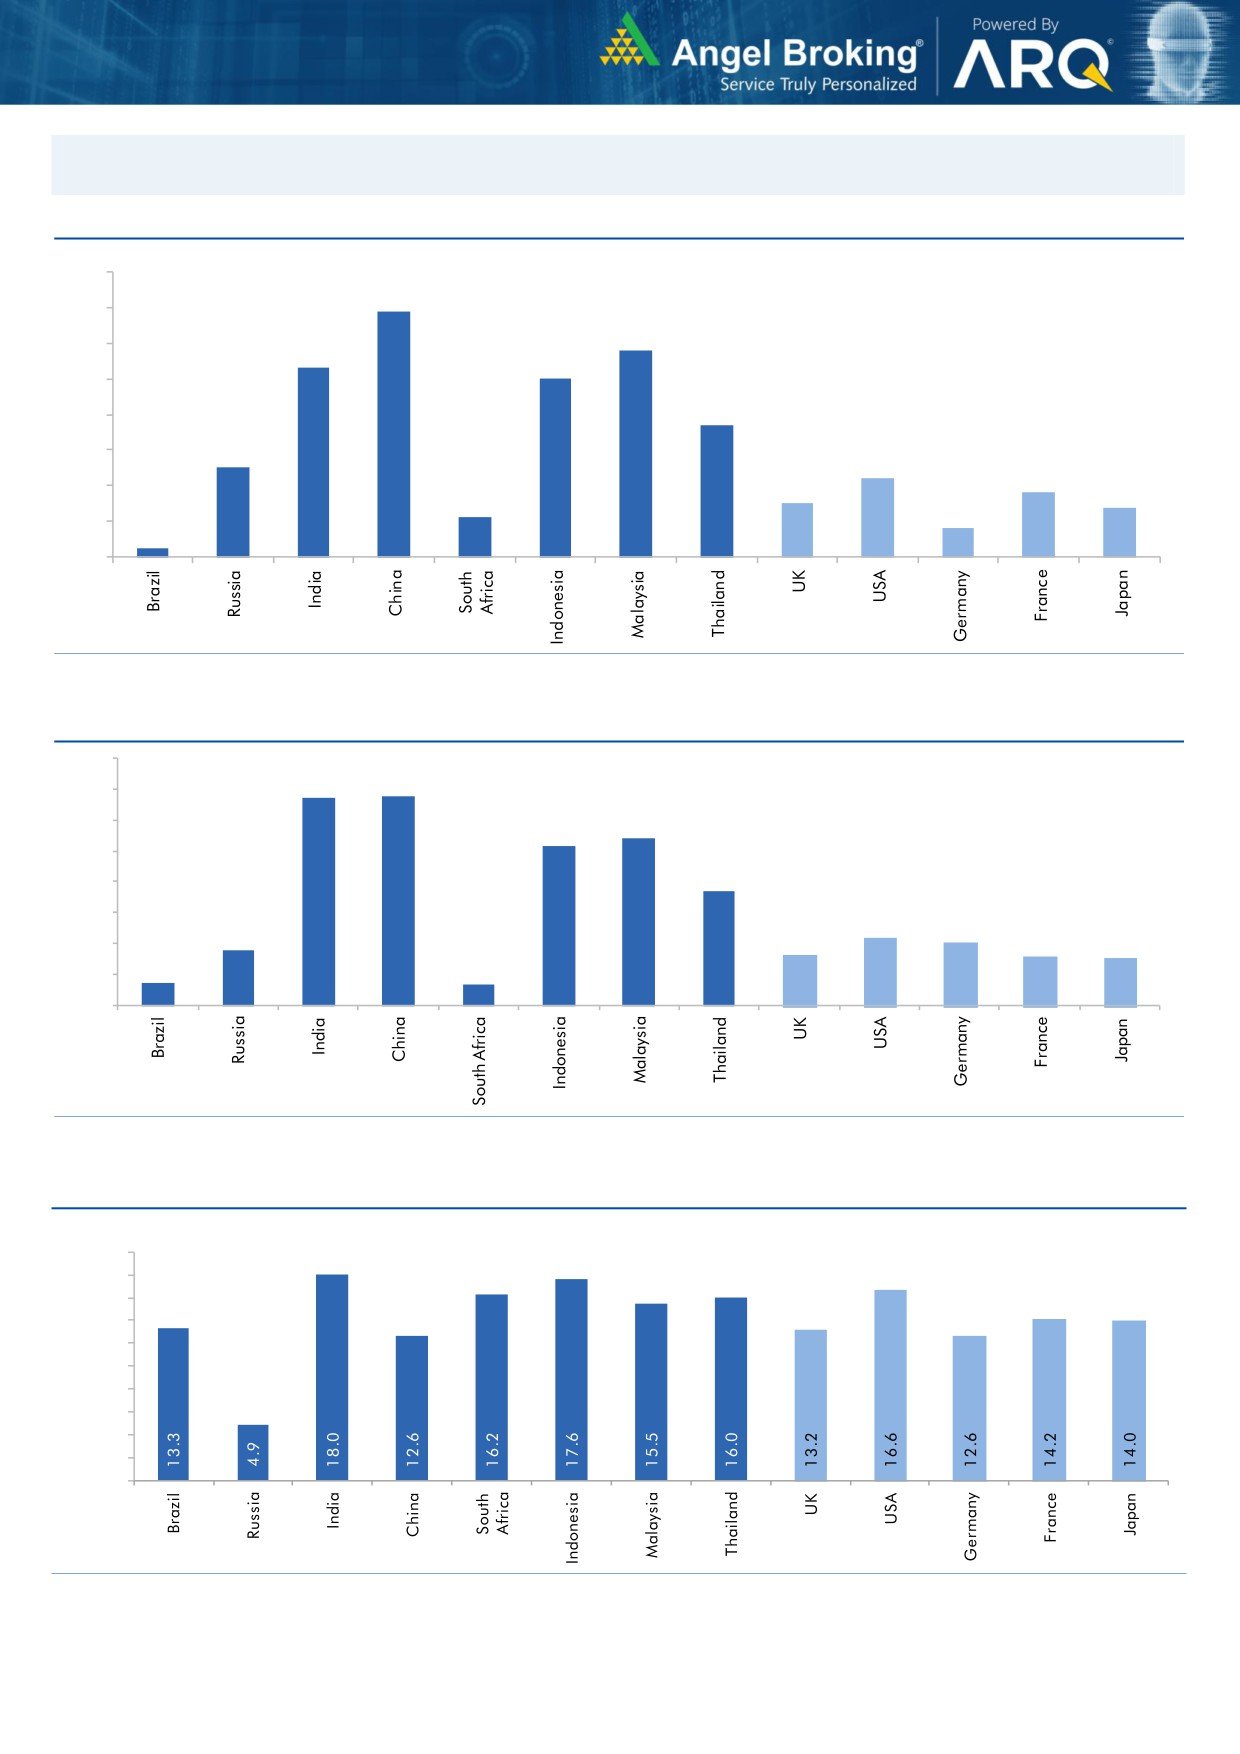
Global watch
Exhibit 1: Latest quarterly GDP Growth (%, yoy) across select developing and developed countries
(%)
8.0
6.9
7.0
5.8
6.0
5.3
5.0
5.0
1.1
3.7
4.0
2.5
3.0
2.2
1.8
2.0
1.5
1.4
0.8
1.0
0.3
-
Source: Bloomberg, Angel Research
Exhibit 2: 2017 GDP Growth projection by IMF (%, yoy) across select developing and developed countries
(%)
6.7
6.8
7.0
6.0
5.4
5.2
5.0
3.7
4.0
3.0
1.8
2.2
2.0
1.7
1.6
2.0
0.7
1.5
0.7
1.0
-
Source: IMF, Angel Research
Exhibit 3: One year forward P-E ratio across select developing and developed countries
(x)
20.0
18.0
16.0
14.0
12.0
10.0
8.0
6.0
4.0
2.0
-
Source: IMF, Angel Research
Market Outlook
March 08, 2018
Exhibit 4: Relative performance of indices across globe
Returns (%)
Country
Name of index
Closing price
1M
3M
1YR
Brazil
Bovespa
85,484
(0.0)
17.6
28.2
Russia
Micex
2,291
0.4
8.8
13.2
India
Nifty
10,154
(7.8)
0.3
14.1
China
Shanghai Composite
3,272
(6.1)
(1.3)
1.0
South Africa
Top 40
52,005
3.0
(2.0)
17.1
Mexico
Mexbol
47,662
(5.4)
0.8
0.5
Indonesia
LQ45
1,054
(4.5)
4.9
19.0
Malaysia
KLCI
1,838
(1.7)
6.8
8.5
Thailand
SET 50
1,170
(1.5)
7.7
19.9
USA
Dow Jones
24,801
(2.8)
2.4
18.9
UK
FTSE
7,158
(2.4)
(2.5)
(2.1)
Japan
Nikkei
21,253
(8.7)
(6.5)
11.2
Germany
DAX
12,245
(3.5)
(6.2)
2.3
France
CAC
5,188
(1.9)
(3.7)
3.8
Source: Bloomberg, Angel Research p68in4